Site Audit Report Detail - Page Performance
Page performance is one of the metrics used by Google to rank web pages in search results. To get high rankings, one of the things that must be considered is to optimize your page performance. It will also have a good impact on your business in the future.
It is important for web owners to know the performance of the pages they have. Through this report, we will present page performance scores, core web vitals, and page timing. The following guideline is designed to make it easier for you to understand and analyze the results of the performance audit of a certain page.
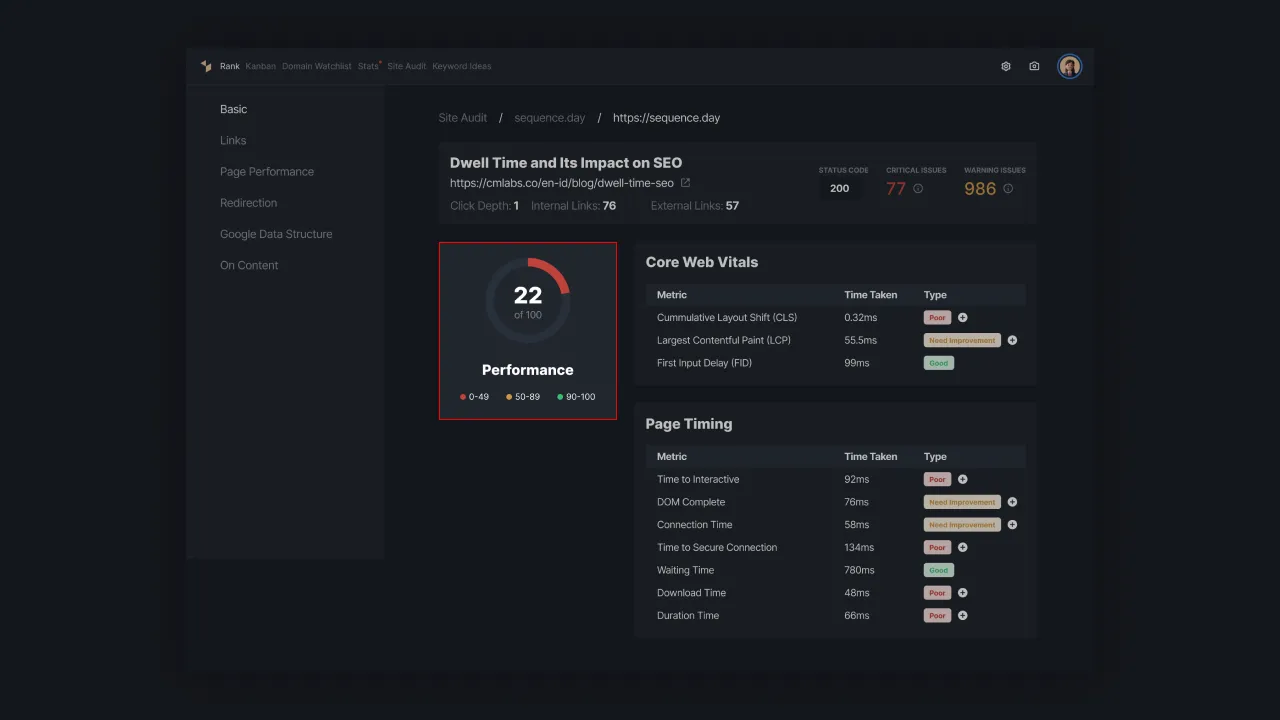
Performance Score
The page performance score displays the results of website testing that are categorized as good, need improvement, or poor. You need to be careful if the score you get is in the 0-49 range because it indicates your site has poor performance and needs to be fixed immediately.
If the score is between 50 and 89, it can be said that the website has performed quite well. However, it is still necessary to improve the metrics that matter according to your page audit data. The highest rating category that can be achieved is in the range of 90-100 with a maximum score of 100, indicating that the web performance is perfect.
 |
|---|
| Figure 1 - Page Performance Score |
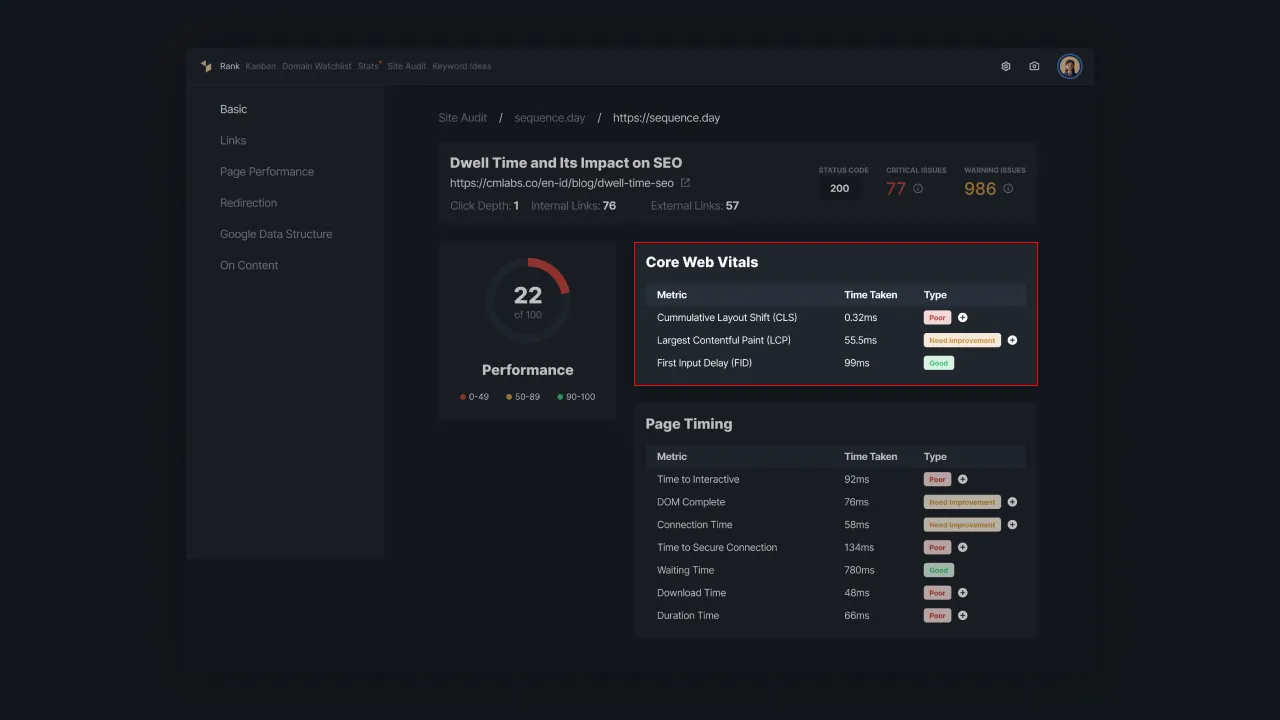
Core Web Vitals
Core Web Vitals tests website speed, display responsiveness, and the stability of the page loading experience for users. The results of the assessment on each page are categorized as Good, Need Improvements, or Poor.
To get a good ranking, make sure your page manages to hit the thresholds defined on each metric. Here are some of the metrics that make up core web vitals, including
- Cumulative Layout Shift (CLS)
CLS is a metric related to the stability of the page layout on your site. Ideally, the CLS value to be achieved is around 0.1 or less. A high CLS value indicates low layout stability, it can degrade the quality of user experience on your pages.
- Largest Contentful Paint (LCP)
LCP relates to the loading speed of the content on your web pages. The content can be in the form of images or long text. The ideal time to load such content is 2.5 seconds or less.
- First Input Delay (FID)
FID is a metric that determines how long it takes for a user to make their first interaction on your website. User interaction can be either clicks or input. The ideal time to achieve this is 100 milliseconds or less.
If there are metrics that need improvement or are poor, you can plan optimization steps by adding new tasks in the Kanban system. Press the plus icon next to the audit result status and our system will display a form to add the optimization task.
 |
|---|
| Figure 2 - The results of the core web vitals metric assessment. |
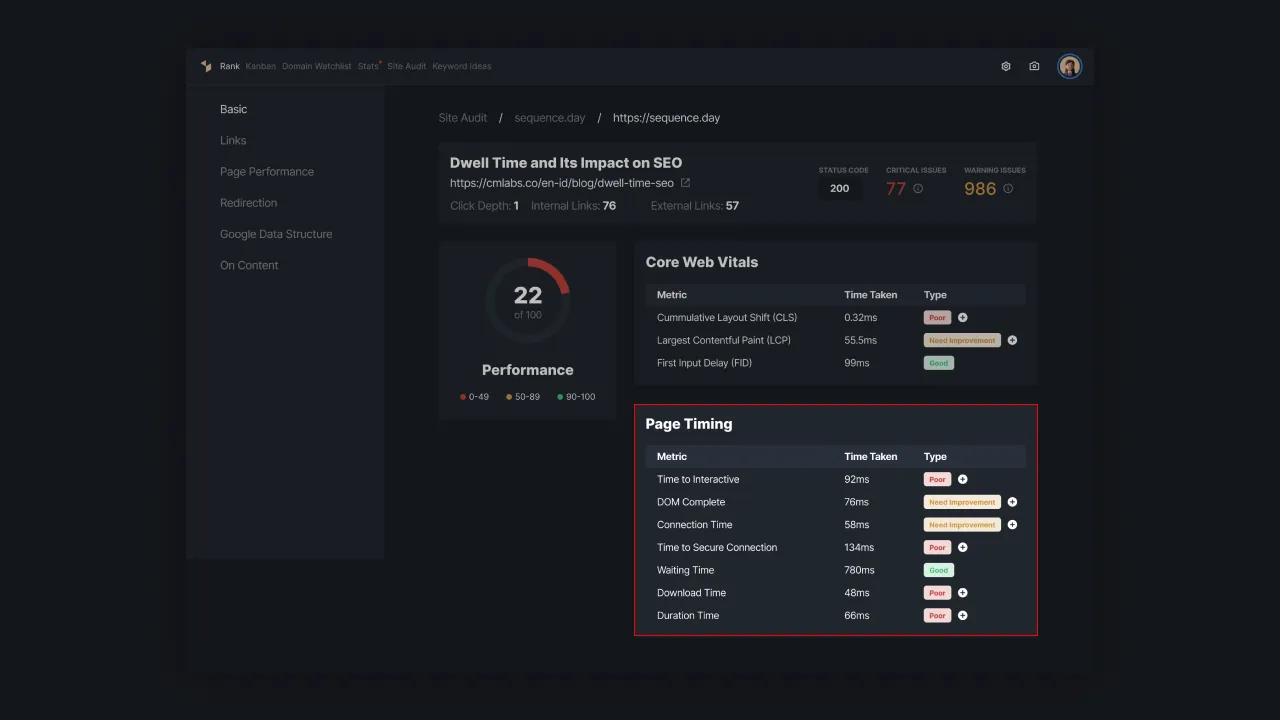
Page Timing
Page timing is the time it takes for a page to meet each of the tested metrics. The report presented contains the name of the metric being tested, the time it takes to complete the metric, to the status of the audit results of each metric. The assessment status is divided into three categories, namely good, need improvement, and poor.
The shorter the time it takes for users to access the resources on your site, the better the audit results will be. The minimum time required varies depending on the type of metric. Some of the metrics related to page timing evaluation include
- Time to Interactive: the time it takes for the page to load most of the content and can respond quickly to user input (less than 50ms).
- DOM Complete: the time it took to load the page and all the resources in it.
- Connection Time: the time it takes the browser to respond to requests made by the user.
- Time to Secure Connection: the time it takes to establish a secure connection between the user and the web browser.
- Waiting Time: the time it takes for the page to respond to user input.
- Download Time: the time it takes the page to download the page content.
- Duration Time: the time it takes from the start to fully load the page.
 |
|---|
| Figure 3 - Page timing metric assessment results. |
Good page performance can make users stay longer on your page. Knowing website performance issues can help you to improve your SEO implementation and user experience. Leave a message at support@sequence.day and our team will be happy to assist you.